Current sales strategies are ineffective because they are not tailored to the specific needs and data of individual points of sale (POS).
Why we’re better
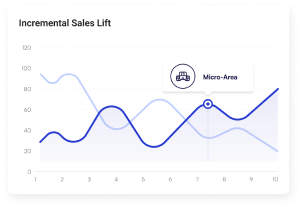
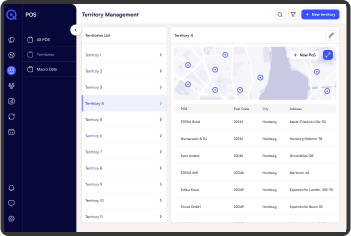
shopeyeQ Value-based PoS Clustering enables advanced analysis based on sales data through our seQ Value Clustering. This allows the value of each POS to be quantified, leading to well-informed strategic decisions. You’ll receive the precise input needed to shape your sales strategies effectively.
Benefits
Empower Your Retail Success
Discover how our platform's advanced features—like dynamic clustering algorithms, real-time insights, and predictive analytics—empower you to drive smarter growth.
GTIN-based sales data (volume and revenue) (must be acquired).
Macroeconomic Data
Unemployment rate, inflation (provided by seQ technology)
Sociodemographic Data
Purchasing power index by postcode, age in the region (provided by seQ technology).
Step-by-Step Process
Map the customer journey
You provide us with your data, which we cluster in the background. We identify lookalikes for you and perform value-based segmentation.
1- Initial Data Collection
Nielsen ID: The user provides their Nielsen ID.
Data Review: We check if the correct data, such as Historic Sales Performance Data, is available or needs to be acquired.
Data Provision: The data is provided to the customer’s cloud (S3, Azure, Snowflake, etc.).
2- Data Processing
seQ Pipeline: Our seQ Pipeline processes, enriches, and clusters the data using Machine Learning, based on current and historic performance data from the last two years.
POS Clustering: A list of POS is generated, each with a cluster label (value-based labels from 1 to 20).
Ranking: This list is ranked based on our seQ Score, which is reviewed weekly.
3- Prioritisation and Actions
Cluster Prioritisation: The user receives prioritisation of clusters and knows which lookalikes are relevant.
Targeted Actions: Based on this data, targeted actions can be taken to optimise sales strategies.
4- Additional Information
seQ Value Metric: The value metric includes GTIN-based sales data (volume and revenue), macroeconomic data (unemployment rate, inflation), and sociogeographic data (purchasing power index by postcode, age in the region, trade dimensions).
Detailed Analysis: For a more detailed analysis, the user provides the relevant GTINs
Additional information
Explore Similar Solutions
You provide us with your data, which we cluster in the background. We identify lookalikes for you and perform value-based segmentation. You can then directly query our platform and receive responses based on these clustered data.
Our seQ Value-based PoS Clustering ranks, clusters, and prioritises data weekly. We ensure that the data is first segmented by its value, allowing you to manage multiple similar POS (lookalikes) simultaneously. This means you only need to develop a strategy for one supermarket and can then apply your insights directly to other similar supermarkets.
The seQ Value Metric incorporates various factors: GTIN-based sales data (e.g., volume and revenue), macroeconomic data (e.g., unemployment rate, inflation), and socio geographic data (e.g., purchasing power index within the postcode, age in the region, trade dimensions). For a detailed analysis, you provide us with the relevant GTINs.
Case Study
Optimizing Retail Insights
This section presents a series of case studies that demonstrate the transformative impact of POS clustering on retail operations.